Coronavirus/COVID around the world
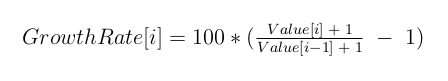
Trends on some indicators : Growth Rate, Incidence Rate and Fatality RateWhat are the meaning of these trends ?The interpretation of these indicators may differ from how they're usually defined. The way they're evaluated here results from the availability of data and, mainly, because this is a new disease in a, still, transitory regime. As data come from many countries at where they aren't collected the same way everywhere, these results are subject to interpretation on each case. Also it's trivial to understand that all this data aren't very reliable, mainly for new cases. Obviously, deaths by COVID are much easier to detect than new cases. Growth Rate :This indicator tells how the total counters incrementally grows since the beginning.
It may be useful just on the beginning of a disease - it's still the case. But after some time have no more sens as its values asymptotically goes to zero. So, after some time (how long ?) we shall switch to some fixed and long enough period. At this point, this indicator may eventually become negative. Incidence Rate :This is the mean count of new events (cases or deaths) evaluated on a one week sliding window per 100000 inhabitants. This indicator is usually evaluated for epidemics already on steady steady state, only for the rate of new cases, in a period much longer than a week, as we do, and related to only people not immunized. Although different from the usual way, these indicators seems interesting. Fatality Rate :This is the ratio between the two incidence rates : deaths and cases. Short term trendAfter each indicator, there is a sign : “/”, “=” or “\” indicating, respectively, an increasing, stable or decreasing short term trend for that indicator. To determine if a value is increasing or decreasing, we make a linear regression on the last 7 values (one week) and check the sign of first order coefficient. A value is considered stable if this coefficient corresponds to a change smaller than 0.2 % in the value. |